AI Safety Analytics: Leading Indicators, Not Lagging Counts
In 2024, 188 Australian workers died at work. Lagging counts come too late. How I use AI and leading indicators in safety analytics to see risk first.
- AI
- Safety Analytics
- Leading Indicators
- WHS
- Predictive Analytics

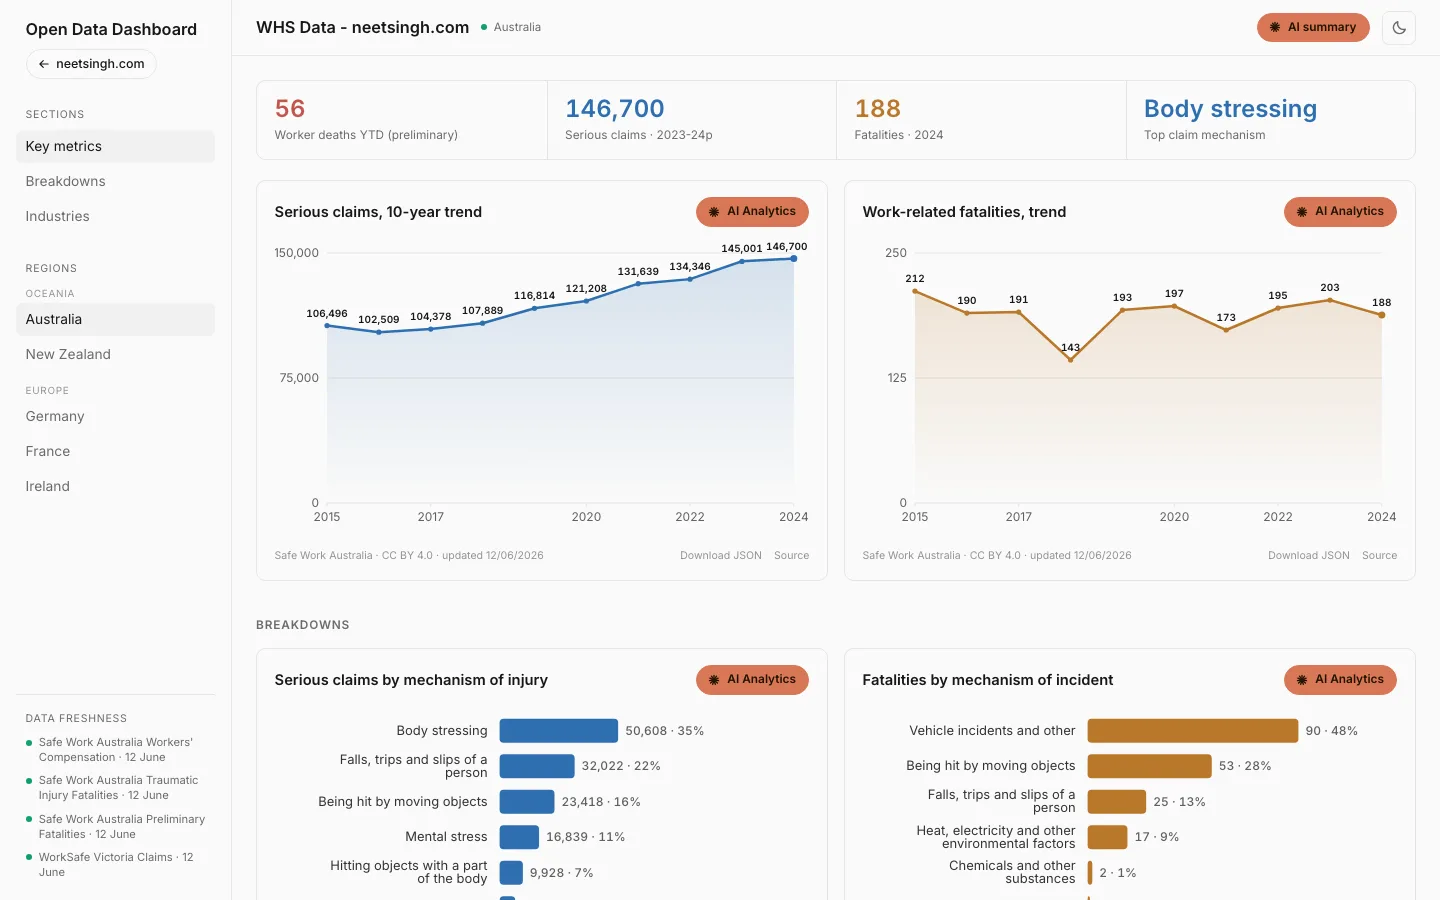
We measure workplace safety mostly by counting what has already gone wrong. In 2024, 188 Australian workers died from traumatic injuries, and in 2023-24 there were 146,700 serious workers' compensation claims, more than 400 a day (Safe Work Australia, 2025). Those are lagging indicators. They are real, they matter, and every one is a person. But they all share a flaw: by the time they move, the harm has happened. Safety analytics gets interesting when you flip the question from "how many were hurt?" to "what is about to hurt someone?", and that is where leading indicators and AI earn their place.
I have spent a decade across WHS, quality and environmental work, investigated critical incidents as an ICAM lead, and run safety performance for a workforce of around 50,000. Lately I have built the predictive analytics and applied AI that sit underneath that work: rolling LTIFR and TRIFR forecasting, and a critical-risk lookahead in Power BI. So this isn't a vendor pitch for predictive safety. It is how I actually use it, and where I keep a human firmly on the decision.
What is the difference between leading and lagging indicators?
Lagging indicators count outcomes after the fact; leading indicators measure the conditions that produce them. ISO 45001:2018, the dominant safety management standard, builds the split into Clause 9.1.1: it asks you to track reactive measures like incidents, injuries and ill-health, and proactive measures like control effectiveness and compliance checks, and to lean on the proactive ones to actually improve (ISO 45001:2018). The UK regulator frames the same idea as "dual assurance", pairing leading and lagging indicators so they act as system guardians (HSE, HSG254, 2006).
In plain terms, here is the divide. Lagging: fatalities, LTIFR, TRIFR, recordable injuries, claims, lost-time days. Leading: hazard and near-miss reporting rates, corrective-action close-out, critical-control verification, safety observations, training completion on high-risk tasks. The lagging set is easy to count and arrives too late to act on. The leading set is harder to measure well, and it is the only one you can still do something about.
Why a low injury rate doesn't mean you're safe
A low injury rate can sit comfortably on top of a fatal risk you are not controlling. This is the part most dashboards get wrong. Serious injuries and fatalities are rare events, so a frequency rate built mostly from minor injuries tells you very little about the risk of someone dying. The research is now blunt about it. A 2024 study in the ASCE Journal of Construction Engineering and Management found the odds that a serious injury or fatality involved a missing direct control were about two orders of magnitude higher than for a low-severity injury, and that human factors did not separate the two (Bayona, Hallowell and Bhandari, 2024). The title says it best: the things that hurt people are not the same as the things that kill people.
That finding quietly dismantles the old safety-triangle logic that shaving minor injuries will pull fatalities down with them. It often won't, because they have different causes. So a falling TRIFR can read as success while the high-energy hazard that actually kills, the vehicle, the fall, the de-energised-but-not-really circuit, goes unverified. Vehicle incidents alone accounted for 42% of Australian worker deaths in 2024 (Safe Work Australia, 2025). The metric most teams manage hardest is the one least connected to the deaths they are trying to prevent.
Australian regulators have started saying so out loud. A SafeWork NSW guide for officers states that LTI and its frequency rate "are inappropriate for informing WHS due diligence and management decisions", and reframes them as productivity measures rather than reliable measures of harm to people (SafeWork NSW, Measuring and reporting WHS information, 2020). If your board pack leads with LTIFR, that is the lagging trap in a single chart.
Do leading indicators actually predict harm?
Yes, when they are tied to real risk and acted on, though the evidence is correlational rather than a guarantee. The clearest case studies come from the Campbell Institute at the US National Safety Council. Cummins calculated a correlation of -0.86 between safety training hours and its injury incidence rate, a very strong negative relationship that held at corporate and business-unit level (Campbell Institute, 2015). In the same Campbell Institute review, Honeywell's Building Solutions unit logged more than 82,000 safety observations in 2013, roughly eight per employee, while recordable injuries fell from 108 in 2010 to 54 in 2013 as observations nearly doubled.
| Category | Value |
|---|---|
| Recordable injuries, 2010 | 108 |
| Recordable injuries, 2013 | 54 |
A broader industry benchmarking study found that setting aggressive leading-indicator targets and holding managers accountable produced an average 77% reduction in incidence rates over 3 to 12 years (Wynn, 2008, as cited by the Campbell Institute). Read those numbers honestly. They are single-company or single-study correlations, not laws, and the same Campbell Institute work warns there is no "perfect mix" of indicators and that any one can lose its predictive power over time. That caveat is the whole reason a person stays in the loop, a point the Institute's 2025 review makes flatly: "metrics don't drive change; people do" (Campbell Institute, 2025).
Where does AI actually help with leading indicators?
AI's contribution is reading data people can't read at scale, then telling you where to look. Three uses hold up under real conditions. The first is unstructured text. Most leading-indicator gold is buried in free-text: near-miss notes, hazard reports, toolbox-talk records. A natural-language system built by Tixier and colleagues scanned unstructured injury reports for 101 safety attributes and outcomes at over 95% accuracy, turning a pile of narratives into structured data you can actually model (Automation in Construction, 2016).
The second is prediction. Pointed at incident records, models can rank where severe outcomes are most likely. A 2026 study trained on construction incidents reached 89% accuracy predicting incident severity with an XGBoost model, though the authors are careful to flag the small, single-region dataset (Scientific Reports, 2026).
Deployed, this looks like the JE Dunn case, where a predictive platform prompted site superintendents to hold 350 extra safety conversations and flagged 75% of recordable incidents on the highest-risk projects each week (NSC Work to Zero, 2023). That is a vendor-reported result, so I read it as direction rather than proof, but the shape is right: the model nudged a leading-indicator behaviour before the lagging count moved.
The third is the one I do most: pattern-finding across datasets too big to hold in your head. On a semantic model spanning tens of thousands of workers, I forecast rolling LTIFR and TRIFR and run a critical-risk lookahead that flags the controls quietly drifting below standard. The model never tells me why. It tells me where to look, which is exactly where most safety analysis stalls. For a worked example of grounding AI in real safety data without letting it invent a number, I wrote up the live WHS open-data dashboard I built.
Why most safety teams aren't ready for this yet
The bottleneck isn't the model, it's the data, and most teams don't have it. You cannot run leading-indicator analytics on inputs you are not capturing. In the 2026 EHS readiness survey, only 11% of organisations had fully digital safety systems while 71% still ran hybrid paper-and-digital workflows (NSC and Wolters Kluwer Enablon, 2026). Adoption is real but shallow: around 82% of EHS leaders use AI to some degree, yet 90% hold at least one concern about it and 65% name overreliance their top risk.
| Category | Value (%) |
|---|---|
| Use AI to some degree | 82% |
| Hold at least one AI concern | 90% |
| Name overreliance their top risk | 65% |
| Run fully digital safety systems | 11% |
This tracks the wider pattern. Across all business functions, 88% of organisations now use AI somewhere, but only about 39% report any measurable bottom-line impact yet (McKinsey, 2025). Safety isn't behind the curve; it is on it. Analysts see the same caution from buyers: 46% of firms are prioritising AI for EHS automation in the next two years, but many still treat predictive AI as unproven and reach first for safer wins like cleaning data and summarising regulation (Verdantix, 2025). The honest read: predictive leading-indicator analytics is promising and early, and the teams that win with it will be the ones who fix their data first.
There is a deeper trap than missing data, though. Garbage in is the obvious one, but bias-in is worse. If your near-misses are under-reported, a model trained on them will learn your blind spots and hand them back as confidence. The same ASCE research that separates serious from minor injuries also found that generic, behaviour-based metrics don't target the events that kill, so an AI optimising the wrong leading indicator can make a dashboard greener while the fatal risk sits untouched.
A practical safety analytics workflow: lagging counts to leading signals
The workflow is simple to state and harder to hold: start from critical risk, let AI read and forecast, keep the human on the call. Here is the order I follow, and it matters, because most teams do it backwards by starting from whatever is easy to count.
- Start from the risks that can kill, not the metrics that are handy. Use a critical-control framework. ICMM's Critical Control Management defines a critical control as one whose absence opens a direct path to a fatality, and treats verification data as a leading indicator (ICMM, 2026).
- Pick leading indicators tied to those controls. Verification rate, close-out of corrective actions, near-miss and hazard reporting, training on high-risk work. The Campbell Institute's 2025 review names close to 20 that work in practice.
- Digitise the inputs. AI can only read what you capture. This is the unglamorous step that decides everything downstream.
- Let AI do the reading. Cluster free-text near-misses, forecast trends, and flag controls drifting below standard or observations that have gone thin.
- Keep the decision human. The model says where to look. You decide what it means, consult the people who do the work, and own the action.
The table below is the translation I keep in my head. It maps the lagging metric everyone already reports to the leading counterpart that predicts it, and to what AI genuinely adds.
| Lagging metric (counts harm) | Leading counterpart (predicts it) | What AI adds |
|---|---|---|
| Fatalities, LTIFR, TRIFR | Critical-control verification rate | Flags controls drifting below standard before they fail |
| Serious claims | Hazard and near-miss reporting; action close-out | Reads free-text reports at scale, clusters precursors |
| Lost-time days | Training completion on high-risk tasks | Correlates training gaps with at-risk crews |
| Investigations (after the event) | Safety observations and conversations per worker | Surfaces where observations are thin, stale or staged |
Does this replace the safety professional?
No, and the survey data says practitioners already know it. AI compresses the reading, the clustering and the first-pass forecasting. It does not consult the crew, weigh a control in context, or carry a duty. That is why 65% of EHS leaders named overreliance their top concern in 2026, and why the Campbell Institute keeps returning to the line that metrics don't drive change, people do. Leading indicators and AI give you something genuinely scarce in safety work: time and attention pointed at the right risk, before it lands.
There is also a hard legal floor under all of this. Under the model WHS Act the primary duty of care sits with the PCBU and cannot be transferred, and in New South Wales the new Digital Work Systems Act now pulls AI and automated systems explicitly inside that duty. So "the model didn't flag it" is no more a defence than "the spreadsheet didn't". Build your analytics around that fact.
If you want the wider principle this sits inside, that AI belongs around the safety decision and not on it, start with the practitioner's field guide. For the same test applied to investigations, see AI for incident investigation, and for grounding a model in primary law rather than its memory, how I encoded the WHS Act into an AI skill. The thread through all of them is the same: let AI read, forecast and draft, and keep the judgement where the duty is.
Frequently asked questions
- What is the difference between leading and lagging safety indicators?
- Lagging indicators count harm after it happens: fatalities, lost-time injury frequency rate (LTIFR), recordable injuries, workers' compensation claims. Leading indicators measure the conditions that predict harm before it lands: near-miss and hazard reporting rates, corrective-action close-out, critical-control verification, training completion. ISO 45001 calls these reactive and proactive measures, and asks you to use both.
- Can AI actually predict workplace incidents?
- It can predict where risk is concentrated, not who gets hurt next. In one peer-reviewed study, an XGBoost model predicted construction incident severity at 89% accuracy, but only on a small single-region dataset (Scientific Reports, 2026). AI points you to the at-risk crews, sites and controls. A competent person still decides what to do.
- Are leading indicators better than LTIFR or TRIFR?
- They answer a different question. Lagging rates tell you what already happened; leading indicators tell you what is building. Serious injuries and fatalities are statistically rare, so a low LTIFR can sit on top of a fatal risk you are not controlling. SafeWork NSW calls LTI and LTIFR inappropriate for informing WHS due diligence. Track both, but manage the leading ones.
- What leading indicators should I track first?
- Start from your critical risks, not from what is easy to count. The highest-value indicator is critical-control verification: are the controls that stop a fatality actually in place and working? Add hazard and near-miss reporting rates, corrective-action close-out, and training completion on high-risk tasks. The Campbell Institute's 2025 review lists close to 20 that teams use in practice.
- Does AI replace the safety professional in analytics?
- No. It changes where your time goes. AI compresses the reading, the clustering and the first-pass forecasting, which frees you for the judgement, the consultation and the field presence that move outcomes. In the 2026 EHS readiness survey, 65% of leaders named overreliance on AI their top concern, and the duty of care still cannot be transferred to a tool.